ID:CTBP1_HUMAN DESCRIPTION: RecName: Full=C-terminal-binding protein 1; Short=CtBP1; EC=1.1.1.-; FUNCTION: Involved in controlling the equilibrium between tubular and stacked structures in the Golgi complex. Functions in brown adipose tissue (BAT) differentiation. Corepressor targeting diverse transcription regulators such as GLIS2. Has dehydrogenase activity. COFACTOR: NAD. Required for efficient interaction with E1A. Cofactor binding induces a conformation change. SUBUNIT: Homo- or heterodimer. Heterodimer with CTBP2. Interacts with PRDM16; the interaction represses white adipose tissue (WAT)- specific genes expression. Interacts with GLIS2, FOXP2, HDAC4, HDAC5, HDAC9 and ZNF217 (By similarity). Interacts with adenovirus E1A protein (via its C-terminus); the interaction disrupts the interaction of CTBP1 with RBBP8. Interacts with Epstein-Barr virus EBNA3 and EBNA6. Interacts with ELK3 (via its PXDLS motif). Interacts with RBBP8 (via its PXDLS motif); the interaction is disrupted by binding to adenovirus E1A. Interacts with FOXP1, HIPK2, PNN, NRIP1, MECOM, ZNF366, ZFHX1B and WIZ. Interaction with SATB1 (non-acetylated form); the interaction stabilizes its attachment to DNA and promotes transcription repression. INTERACTION: Q9BXL5:HEMGN; NbExp=2; IntAct=EBI-908846, EBI-3916399; Q14526:HIC1; NbExp=4; IntAct=EBI-908846, EBI-2507362; Q96EK4:THAP11; NbExp=2; IntAct=EBI-908846, EBI-1790529; A2APF7:Zbp1 (xeno); NbExp=2; IntAct=EBI-908846, EBI-6115394; Q8N895:ZNF366; NbExp=5; IntAct=EBI-908846, EBI-2813661; SUBCELLULAR LOCATION: Cytoplasm. Nucleus. PTM: The level of phosphorylation appears to be regulated during the cell cycle. Phosphorylated upon DNA damage, probably by ATM or ATR. Phosphorylation by HIPK2 on Ser-422 induces proteasomal degradation. PTM: ADP-ribosylated; when cells are exposed to brefeldin A (By similarity). PTM: Sumoylation on Lys-428 is promoted by the E3 SUMO-protein ligase CBX4. SIMILARITY: Belongs to the D-isomer specific 2-hydroxyacid dehydrogenase family.
The RNAfold program from the Vienna RNA Package is used to perform the secondary structure predictions and folding calculations. The estimated folding energy is in kcal/mol. The more negative the energy, the more secondary structure the RNA is likely to have.
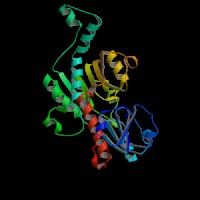
ModBase Predicted Comparative 3D Structure on Q13363
Front
Top
Side
The pictures above may be empty if there is no ModBase structure for the protein. The ModBase structure frequently covers just a fragment of the protein. You may be asked to log onto ModBase the first time you click on the pictures. It is simplest after logging in to just click on the picture again to get to the specific info on that model.
Orthologous Genes in Other Species
Orthologies between human, mouse, and rat are computed by taking the best BLASTP hit, and filtering out non-syntenic hits. For more distant species reciprocal-best BLASTP hits are used. Note that the absence of an ortholog in the table below may reflect incomplete annotations in the other species rather than a true absence of the orthologous gene.
Gene Ontology (GO) Annotations with Structured Vocabulary
Molecular Function: GO:0001106 RNA polymerase II transcription corepressor activity GO:0003700 transcription factor activity, sequence-specific DNA binding GO:0005515 protein binding GO:0008022 protein C-terminus binding GO:0008134 transcription factor binding GO:0016491 oxidoreductase activity GO:0016616 oxidoreductase activity, acting on the CH-OH group of donors, NAD or NADP as acceptor GO:0016618 hydroxypyruvate reductase activity GO:0019904 protein domain specific binding GO:0030267 glyoxylate reductase (NADP) activity GO:0042802 identical protein binding GO:0042803 protein homodimerization activity GO:0051287 NAD binding GO:0070491 repressing transcription factor binding
Biological Process: GO:0000122 negative regulation of transcription from RNA polymerase II promoter GO:0006351 transcription, DNA-templated GO:0006355 regulation of transcription, DNA-templated GO:0006468 protein phosphorylation GO:0008152 metabolic process GO:0008285 negative regulation of cell proliferation GO:0016032 viral process GO:0019079 viral genome replication GO:0030154 cell differentiation GO:0031065 positive regulation of histone deacetylation GO:0035067 negative regulation of histone acetylation GO:0045892 negative regulation of transcription, DNA-templated GO:0050872 white fat cell differentiation GO:0051726 regulation of cell cycle GO:0055114 oxidation-reduction process GO:0090241 negative regulation of histone H4 acetylation GO:1903758 negative regulation of transcription from RNA polymerase II promoter by histone modification
BC064333 - Homo sapiens C-terminal binding protein 1, mRNA (cDNA clone IMAGE:5806192). BC072021 - Homo sapiens C-terminal binding protein 1, mRNA (cDNA clone IMAGE:6338360), partial cds. BC053320 - Homo sapiens C-terminal binding protein 1, mRNA (cDNA clone MGC:59831 IMAGE:6461670), complete cds. BC098400 - Homo sapiens C-terminal binding protein 1, mRNA (cDNA clone MGC:104684 IMAGE:30344174), complete cds. BC011655 - Homo sapiens C-terminal binding protein 1, mRNA (cDNA clone MGC:12707 IMAGE:4128336), complete cds. AF091555 - Homo sapiens C-terminal binding protein (CTBP1) mRNA, complete cds. U37408 - Homo sapiens phosphoprotein CtBP mRNA, complete cds. JD462896 - Sequence 443920 from Patent EP1572962. JD233287 - Sequence 214311 from Patent EP1572962. DQ891918 - Synthetic construct clone IMAGE:100004548; FLH181405.01X; RZPDo839D01136D C-terminal binding protein 1 (CTBP1) gene, encodes complete protein. KJ890995 - Synthetic construct Homo sapiens clone ccsbBroadEn_00389 CTBP1 gene, encodes complete protein. DQ895102 - Synthetic construct Homo sapiens clone IMAGE:100009562; FLH181401.01L; RZPDo839D01135D C-terminal binding protein 1 (CTBP1) gene, encodes complete protein. AB527760 - Synthetic construct DNA, clone: pF1KB7987, Homo sapiens CTBP1 gene for C-terminal binding protein 1, without stop codon, in Flexi system. KJ534818 - Homo sapiens clone CTBP1_iso-C_adult-A04 C-terminal binding protein 1 isoform C (CTBP1) mRNA, partial cds, alternatively spliced. KJ535006 - Homo sapiens clone CTBP1_iso-D_adult-A07 C-terminal binding protein 1 isoform D (CTBP1) mRNA, complete cds, alternatively spliced. KJ535043 - Homo sapiens clone CTBP1_iso-F_fetal-F14 C-terminal binding protein 1 isoform F (CTBP1) mRNA, complete cds, alternatively spliced. KJ535050 - Homo sapiens clone CTBP1_iso-E_fetal-F15 C-terminal binding protein 1 isoform E (CTBP1) mRNA, complete cds, alternatively spliced. KJ535065 - Homo sapiens clone CTBP1_iso-B_adult-A02 C-terminal binding protein 1 isoform B (CTBP1) mRNA, complete cds, alternatively spliced. KJ535066 - Homo sapiens clone CTBP1_iso-B_adult-A03 C-terminal binding protein 1 isoform B (CTBP1) mRNA, complete cds, alternatively spliced. KJ535067 - Homo sapiens clone CTBP1_iso-A_adult-A01 C-terminal binding protein 1 isoform A (CTBP1) mRNA, complete cds, alternatively spliced. CU690950 - Synthetic construct Homo sapiens gateway clone IMAGE:100022506 5' read CTBP1 mRNA. AL137653 - Homo sapiens mRNA; cDNA DKFZp434B0914 (from clone DKFZp434B0914). JD023886 - Sequence 4910 from Patent EP1572962. JD027727 - Sequence 8751 from Patent EP1572962. JD193291 - Sequence 174315 from Patent EP1572962.
Biochemical and Signaling Pathways
BioCarta from NCI Cancer Genome Anatomy Project h_ctbp1Pathway - SUMOylation as a mechanism to modulate CtBP-dependent gene responses h_wntPathway - WNT Signaling Pathway
Reactome (by CSHL, EBI, and GO)
Protein Q13363 (Reactome details) participates in the following event(s):
 Sequence and Links to Tools and Databases
  Common Gene Haplotype Alleles